One platform to connect, organize, visualize, and share your marketing data
Whatagraph is an all-in-one intuitive marketing data platform that will take manual tasks and hassle away from your marketing data management process. So you regain time and focus on what really matters - strategy and execution.
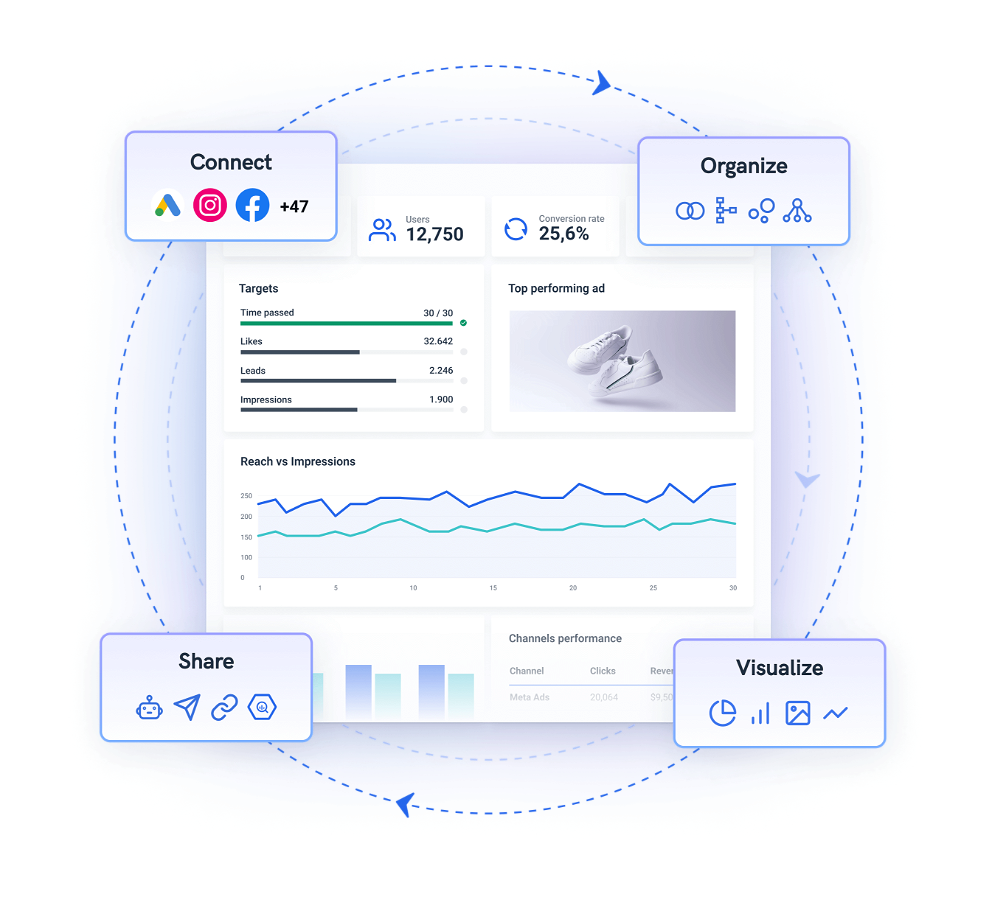


Replace multiple complex tools with one easy-to-use platform
Working with data becomes faster and easier when you use a single marketing data platform to cover all the steps.
Remove hassle from daily work with data saving dozens of hours in the process
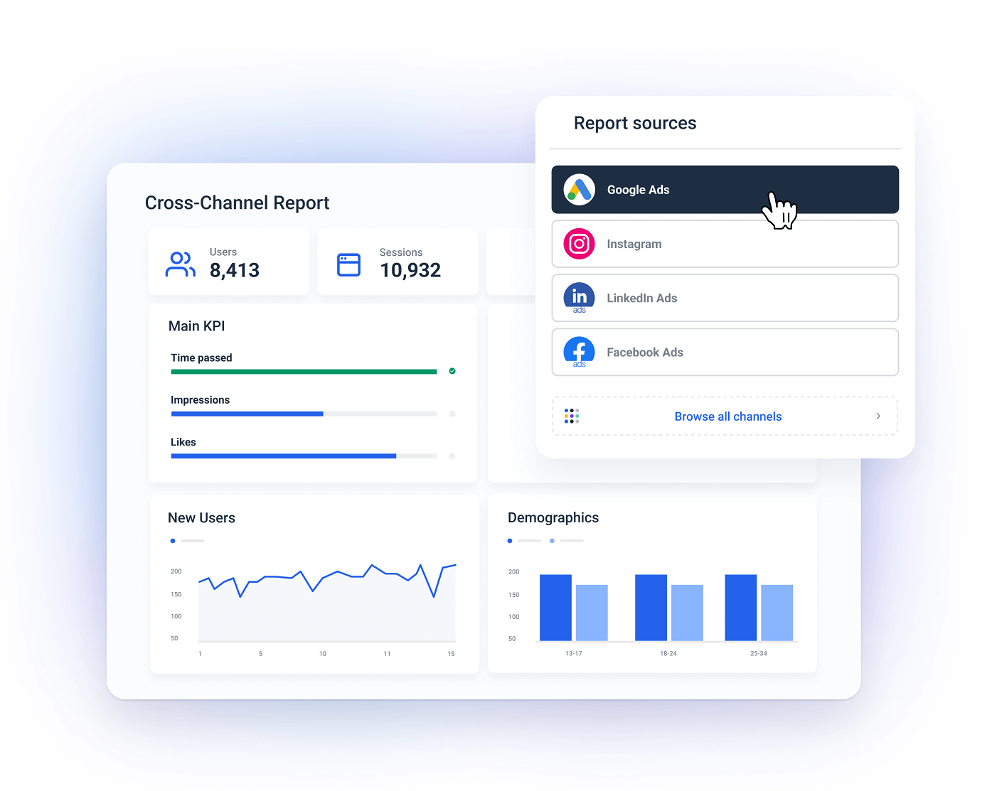
Every marketing data point in one easy-to-navigate solution
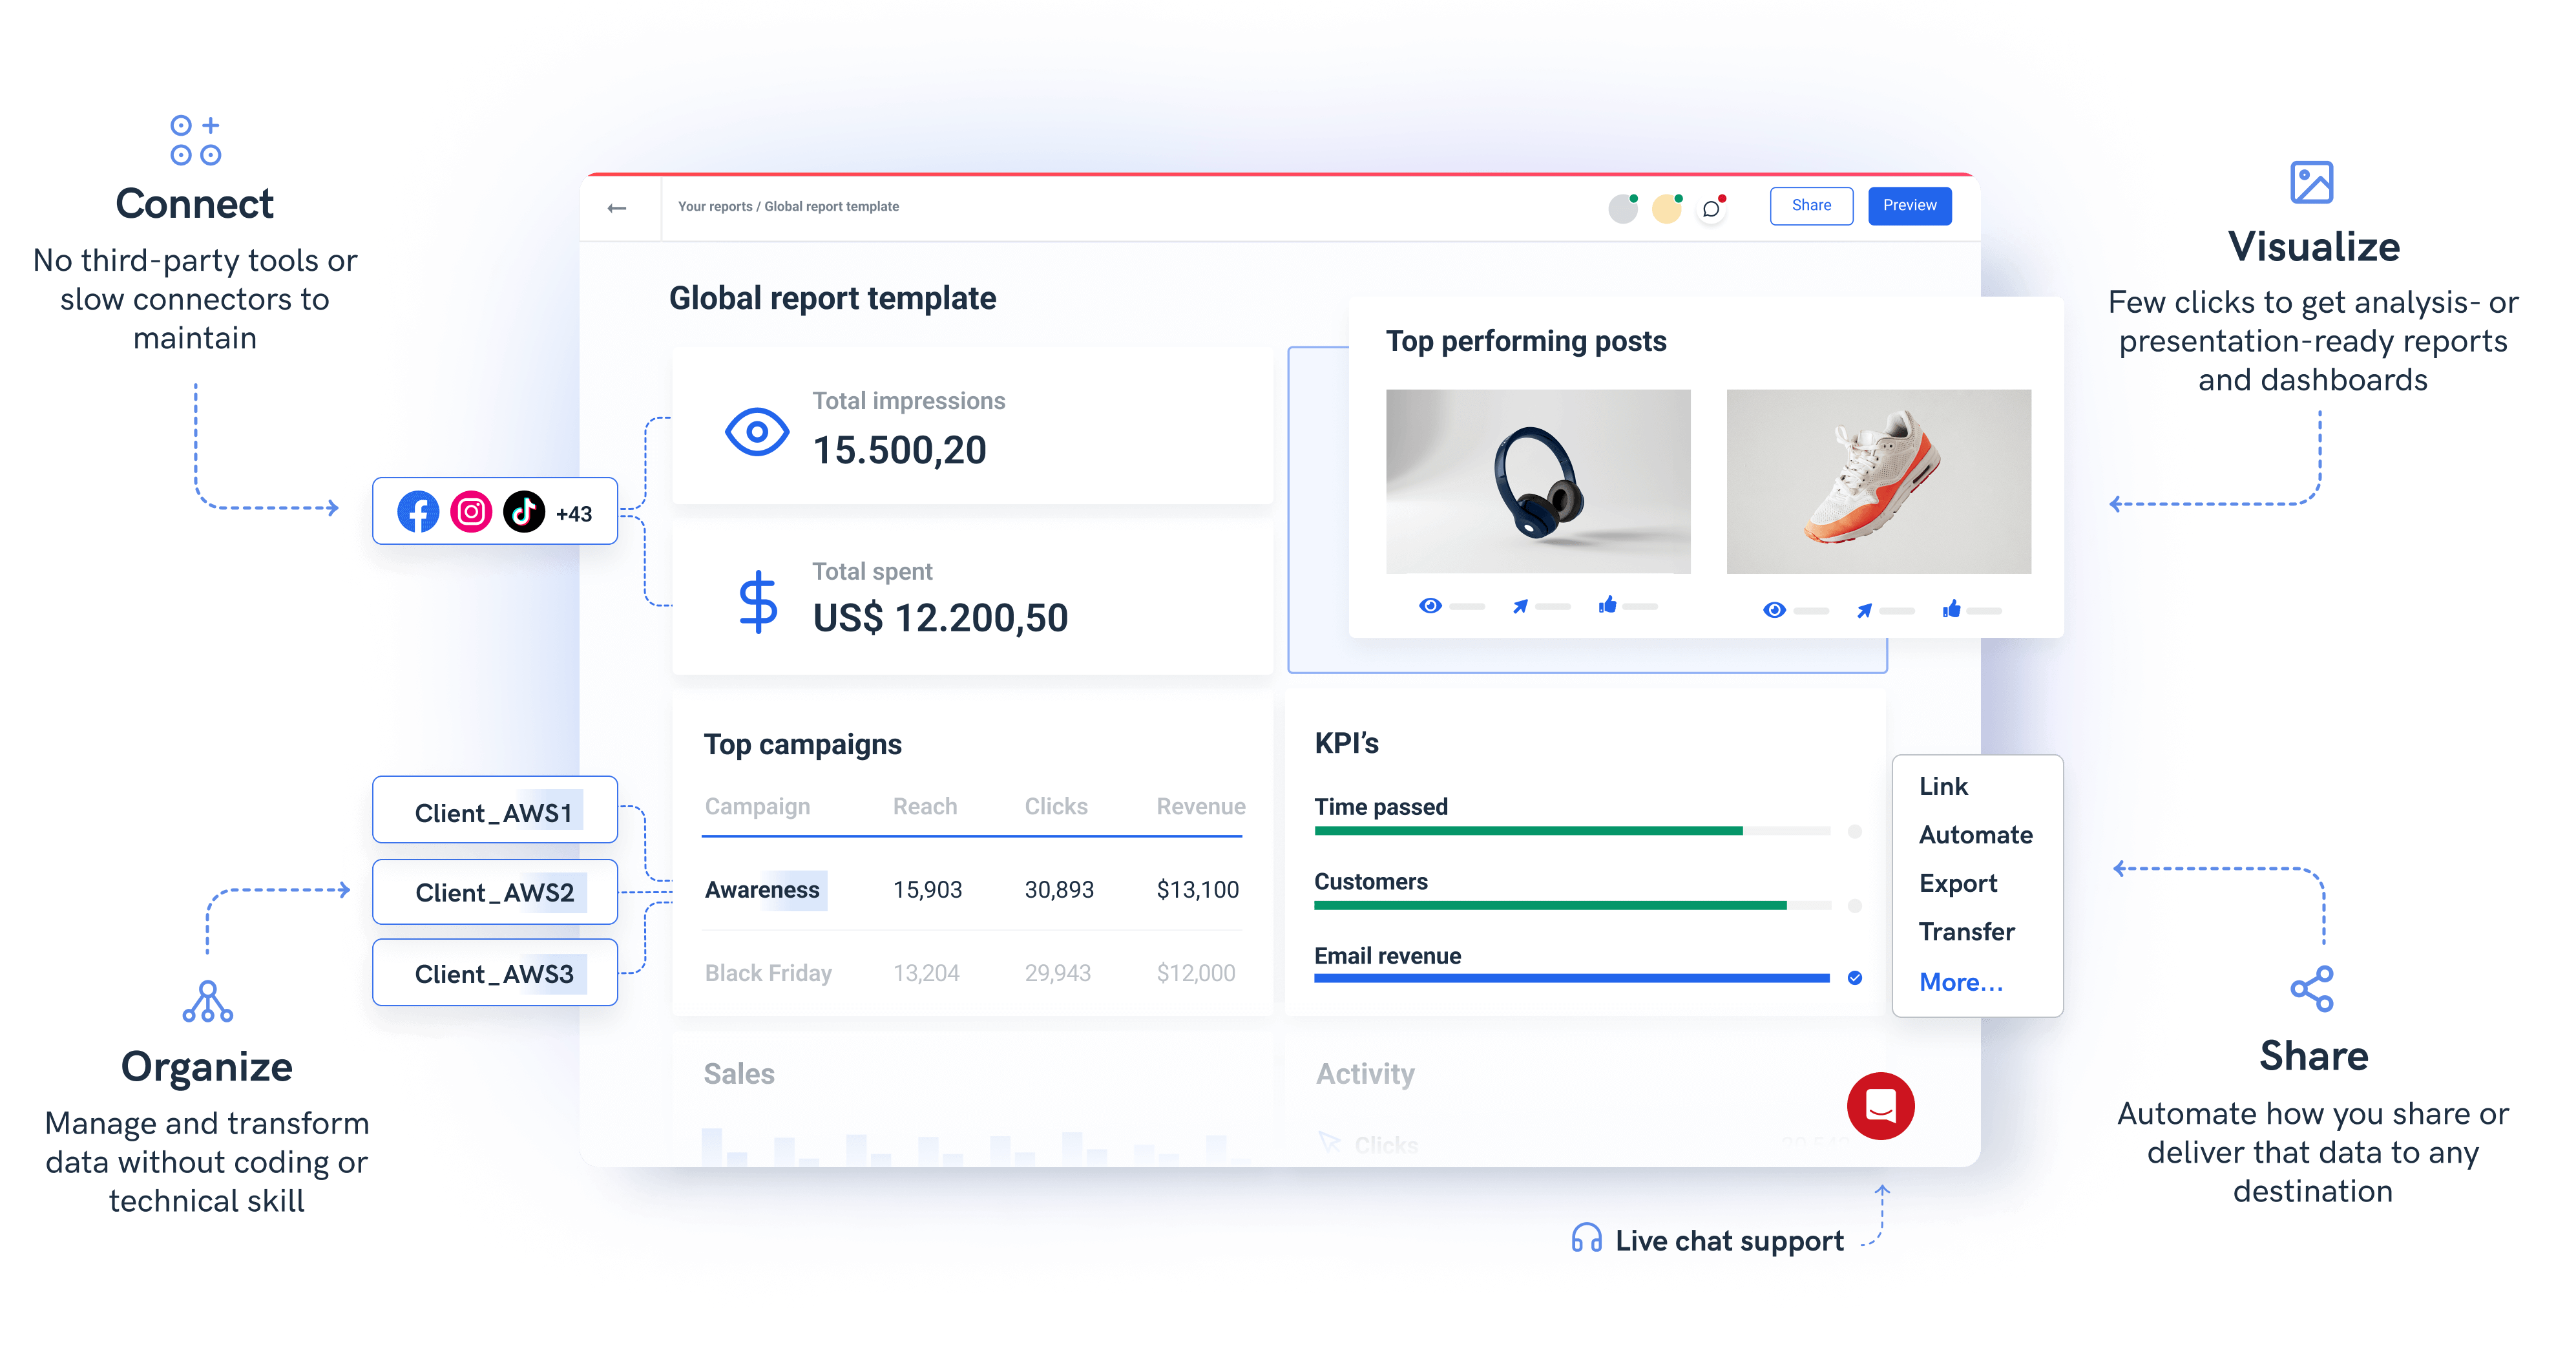
All your cross-channel data connected in a single hub, making it easy to track performance, measure ROI, and present results. No third-party connectors or tools to manage and maintain.

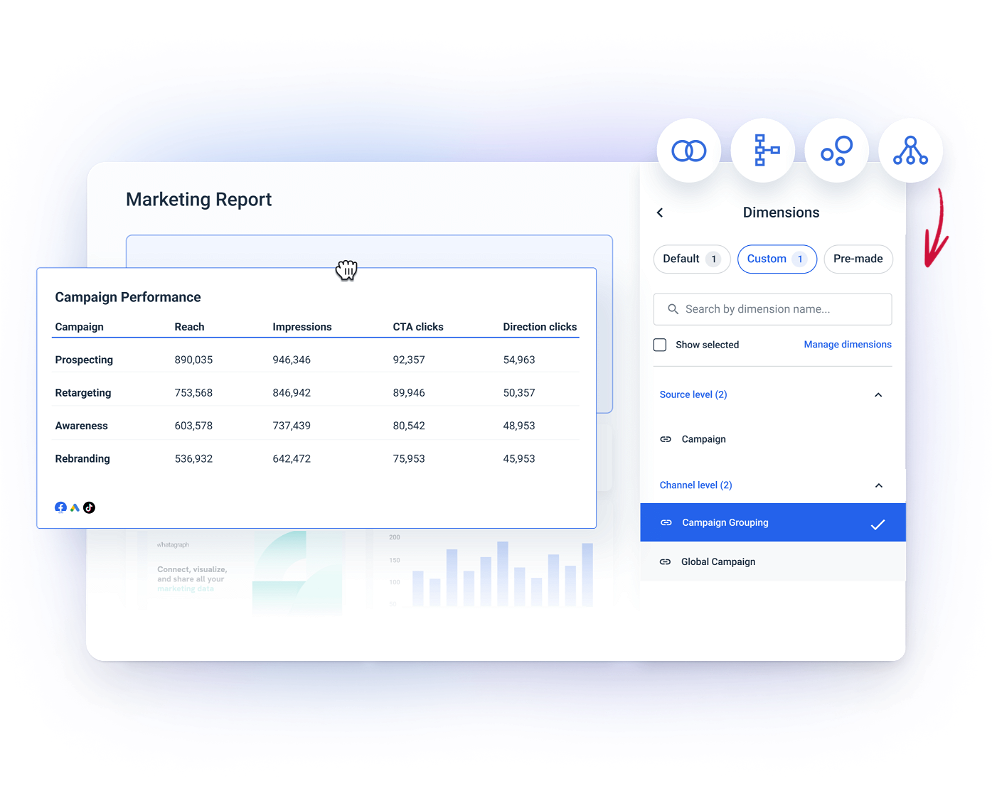
Manage and organize scattered cross-channel data with no-code transformations
You can intuitively blend, unify, aggregate, and group data. Your transformations are instantly available for visualization and any data manipulation can be saved, reused, and easily adjusted by anyone in a team.
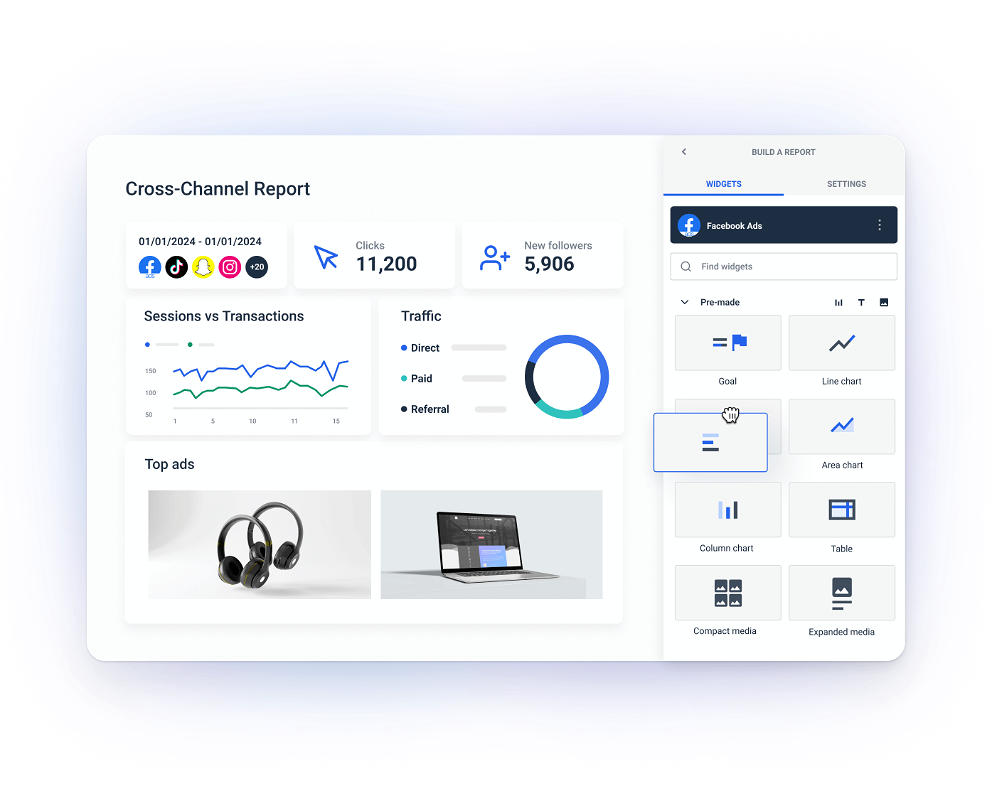
Create stunning data visualizations in a few clicks
Tell the story with your connected and prepared cross-channel data. Quickly turning it into analysis or presentation-ready reports, dashboards, or standalone graphs, charts, funnels, or tables.
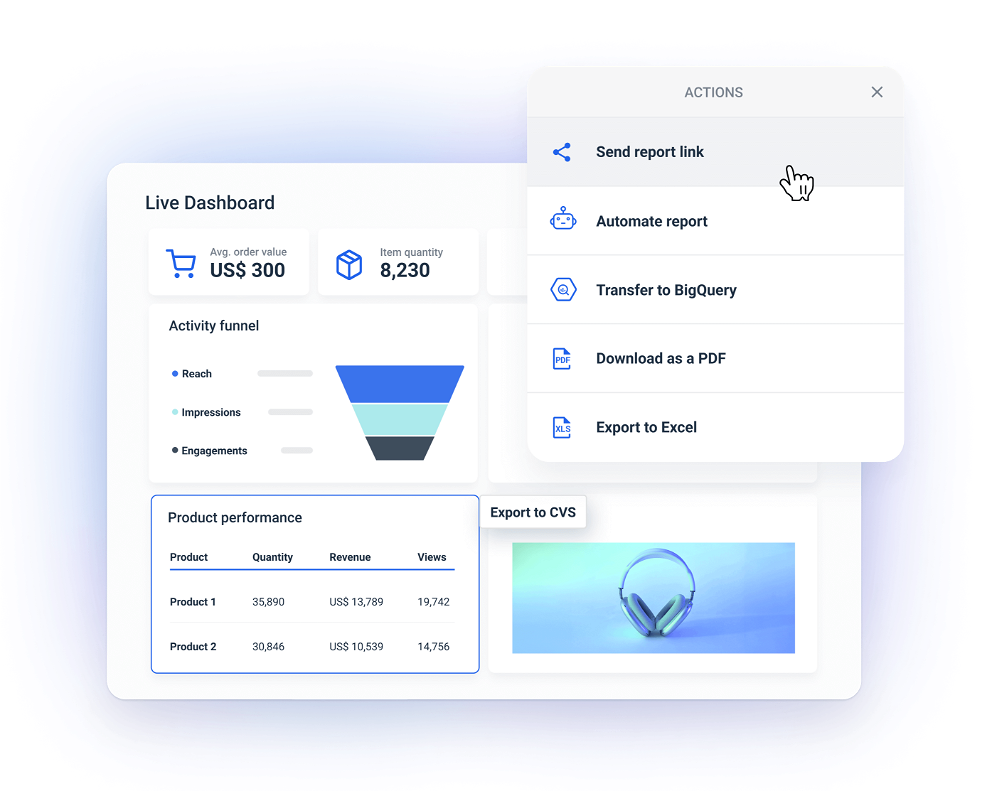
Automate how you share or deliver that data to any desired destination
Share links to live dashboards, automate report send-out, or move data to other tools and platforms like the BigQuery warehouse. Get your data where, when, and how you need it.
Managing data is no longer hard

What others think about Whatagraph
I made a switch from GDS and Sheets for reporting to Whatagraph, and I am saving literal hours each week on performance report creation. Our small firm actually managed to onboard 2 new clients as a result of all the time we saved on managing data and reporting. The customer service is also really helpful and easy to reach.

Capterra verified review by
Mindaugas S., Marketing Consultant
Having active customer support to help fix any issues was a big contributor, but we also really liked the ability to save templates and connect sources to multiple charts/widgets at once without having to edit them individually. And having the grid layout is much easier to stay consistent with than the free form setup that Data Studio has.

Capterra verified review by
Nico T., Media Planner
The system has standard templates that are easy and fast to use. Also you can build your own report with lightning speed. It is very easy to use, has a lot of integration, and let get started very fast.

Capterra verified review by
Rasmus Bernt K., External Senior Management Consultant
We love Whatagraph - we would definitely recommend and our account manager is great! I love how easy this tool is to use, everyone on the team finds it much more user-friendly than other dashboards. Integration was easy, we sent some example reports to the team who duplicated these for us. We literally had to log in and send it to our clients!

Capterra verified review by
Stephanie S., Digital Director
We are showing our clients the work that we're doing for them and this is incredibly important for our clients ROI. They want to see results and having a tool like Whatagraph that can show data from virtually every source we use is hugely important.

Capterra verified review by
John S., SEO Strategist
The tool is easy to use; you do not need to have development resources. Even my junior project managers are capable of making campaign reports in minutes. There are a lot of pre-made templates you can use as well as many pre-made widgets.

Capterra verified review by
Erman E., Marketing Specialist
Really easy to connect data sources within the tool. The library of report templates has been helpful. The customer support team has been responsive to all of our needs. Our team enjoys the simplicity of setting up the reports and how the data is presented.

Capterra verified review by
Brent N., Director of Operations
Easy to create really beautiful graphs and reports which can help other team members to understand the most important takeaways. I especially like the automated report function, so I don't have to check on the same thing repeatedly.

Capterra verified review by
Orsolya S., Online Marketing Manager
Read more reviews on:


